How I Broke (my own) Production & How I Fixed it 4 Hours Later
An Adventure in Deploying Next.js Apps with Bun, Turborepo, and SST from a CI
By Lani Akita
|
Source: Artem Horovenko (via Unsplash). On the left side of the image, there are two adjacent pairs of large blue tubes, aligned vertically, and running from the left to the center of the image, featuring a convex-fairing, and a grate over their respective openings. In the background we can see more large blue tubes, curving left and right, with steel cages and catwalks adjacent to them. On the right side of the image, there are six large green tubes, placed vertically, and spaced tightly together, running from top to bottom of the image.
Since I finally managed to break the CI/CD pipeline for this site, I've been thinking a lot about that infamous quote from the Senator for Alaska. Not for its accuracy (or lack thereof), but because in this one instance, I did, in fact, break (or jam) a critical tube that gets this site out to the internet. Though, I should admit that's not what took this site offline for 4 hours (we'll get to that part soon).
The Situation
At around 0600 Zulu time on February 21st, I rebased this site's production branch with main, and pushed two of my latest commits. One updated my flake.nix inputs (updated flake.lock), the other was a simple fix to the cards on the landing page. About 30 minutes later I received the following email.
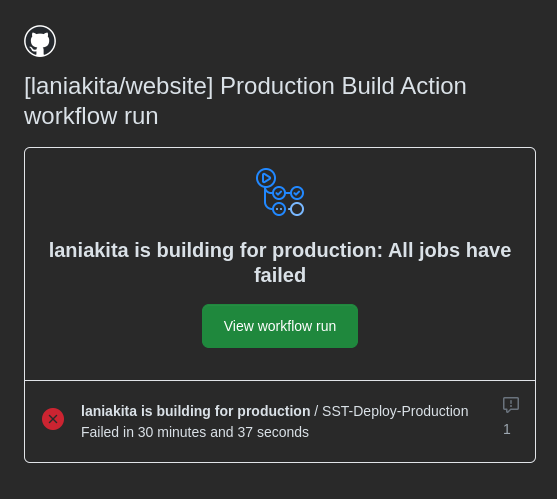
What followed was what I can only describe as an adventure.
That skeet now serves as both a historical record of what happened that Thursday night, and was the inspiration behind this very blog post.
A Preliminary Investigation
Debugging is an Art. While I'm not the world's greatest detective, I am pretty good at sniffing out the cause of the issue, and assembling a solution thereafter. So, let's go through what I did.
POI #01: Timing Out & Freezing
The first thing I did was look into the workflow logs, where I discovered our first Point of Interest (POI), the timeout error.
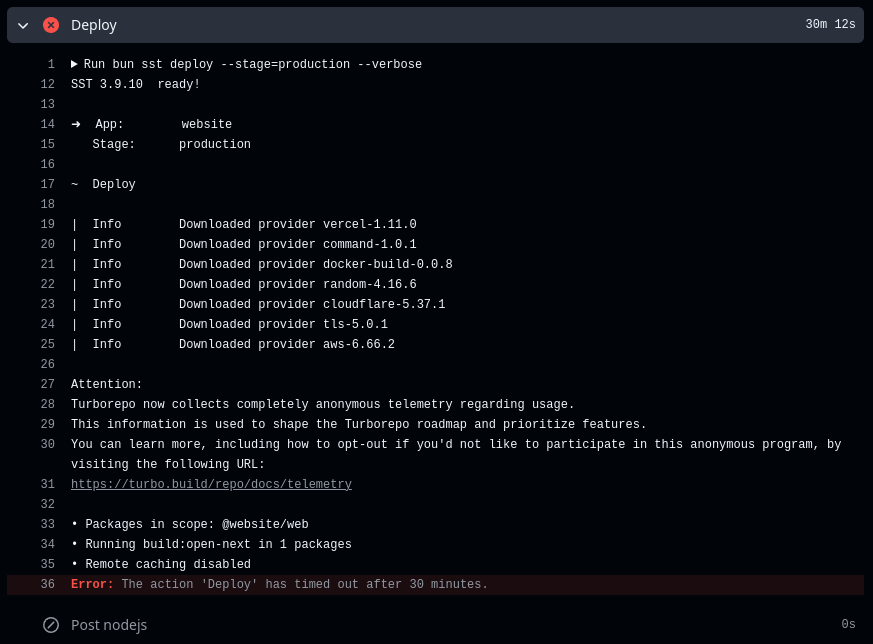
Given my experience with the beta version of SSTv3 (Ion), an occasional timeout on sst deploy wasn't entirely unexpected. It's why I set timeout-minutes: 30 on the Deploy step in the first place. So, I decided to give it another go.

This gave a Locked state error, since the previous deploy attempt didn't get to gracefully cancel deployment to AWS. So, following the error message's guidance, I ran sst unlock from my terminal and tried again.

Huh. I was audibly stunned. Watching this attempt go by, I was confounded why it was stuck at the same place as the first attempt. At about a minute and 23 seconds in, I pulled the plug.
While that might seem pre-emptive, compared to a successful production run up to this point, the process would be about half way done by now, so freezing up at line 39 was incredibly odd.
Troubleshooter's Step 01: Unplug it and Plug it Back in
I was feeling puzzled, until I was suddenly struck with genius. I would simply perform the equivalent of unplugging and plugging it back in again via running sst remove and sst deploy, magically solving my problems! What could go wrong?
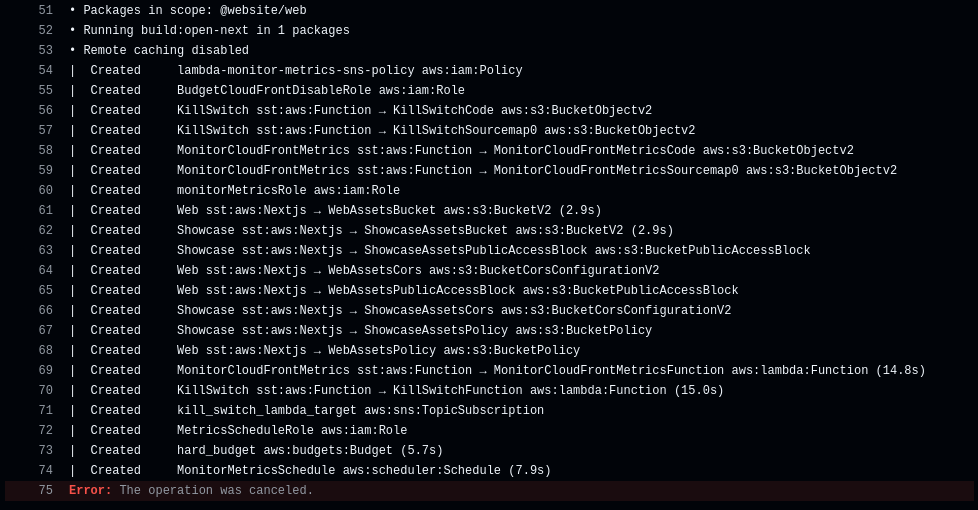
While I was grateful that attempt 04 displayed some signs of life, at about 4 minutes into the Deploy however, it was clear something had gone wrong. So, I pulled the plug on this attempt too.
To make matters worse, because I did run sst remove --stage=production, my production site was now ripped from the internet. While this would be fine if I had either a backup to divert traffic to, or realized I could've just re-run the last passing production Build Action, I unfortunately did not. This was cause for some light panic.
Hubris: All in on Production
If you notice the repo for this site today, there's now two workflows I use: one for dev and one for production. However, it wasn't like that before this happened.
Why? Well, one part of it was stinginess, another was avoiding the work to add a dev build banner into the nav when the URL !== productionUrl. The rest of it though? That was arrogance. My hubris.
However, that's not to say I didn't have a dev deployment stage. I setup a dev AWS account specifically to live test radical changes of this site, before I rebased them into production.
At the time, I figured that was good-enough, and a dev CI/CD would be something nice to have. I suppose I didn't feel strongly enough then to follow through with a proper CI/CD to handle main for this little blog/portfolio thing. That was a foolish error on my part.
Troubleshooter's Step 02: Update Deps
As I was reeling from terror, I decided to try an emergency dependencies update of Node.js and Turbo. I didn't have any evidence that they weren't the cause of the problems, but a cheap hail-mary attempt seemed worth a shot.

No dice. As a follow-up, I wondered if re-creating bun.lock might help, so I tried that too.

As you can imagine, that didn't work either.
Troubleshooter's step 03: Pin Deps
If updating dependencies wasn't working, perhaps pinning them to an older version might help. I decided sst might be playing a role here, so I rolled it back, and ran the CI again.

Oops. I correct the Lock once more, and sent through my final hail mary attempt for the evening.

Sigh. I let out a pained sigh. This is gonna require thinking, isn't it?, I whined to myself. So, I took a break for a couple of hours, and contemplated.
Approaching a Solution
After my basic troubleshooting session brought me to somewhere worse than square one (no website), I started mulling over what I learned.
What I found peculiar, was that consecutive runs would hang around the same place. For whatever reason, attempting to build @website/web (this site), would lockup the Deploy step either right away (if the other functions don't exist yet), or 75 lines in if my metrics monitoring functions need to be created. Either way, this pointed to something going wrong with how @website/web was being built.
New POIs
This realization, narrowed things down to a few potential causes:
@website/webis being built, but something is failing to report that step finished (sigterm), freezing the Deploy step as a result.@website/webis failing to build in the CI runner for reasons.- Perhaps the
sstCLI has a bug in reading the flag syntax? - Perhaps Ubuntu/Debian is being difficult with SST again (I think this was an issue during the beta).
- Perhaps the
- The Turborepo tasks for
@website/webaren't being executed properly.- A task that occurs before
build, liketest, might be failing to send asigterm, orbun/sst/turbois failing to pick it up. - In any event, the
buildtask for@website/webgets stuck waiting to be executed, causing the hang.
- A task that occurs before
So, I decided to go down this list from ez to difficult in trying to solve the problem.
Too EZ: Check your syntax
While I can't find the relevant issue now, I do remember coming across a closed issue in the sst repo, detailing that running a command like sst COMMAND --FLAG=VAR was causing issues but sst COMMAND --FLAG VAR wasn't. I believe I tried to run this locally, but that didn't fix it, so I moved on.
Redefining Turborepo's Tasks
Armed with the possibility the tasks weren't executing properly, I decided to remove the prebuild task as dependency of test from the turbo.json in both @website/web and @website/showcase. I also made build depend on other build tasks first (suggested by the turborepo docs)
    "test": {
-      "dependsOn": ["prebuild"]
+      "dependsOn": []
    },
    "build": {
-      "dependsOn": ["test"],
+      "dependsOn": ["test", "^build"],
I also changed the buildCommand (for both web and showcase) in my sst.aws.Nextjs function to specify bun specifically.
export const web = new sst.aws.Nextjs("Web", {
  path: "apps/web",
-  buildCommand: "turbo build:open-next",
+  buildCommand: "bun run turbo build:open-next;",
  server: {
    runtime: "nodejs22.x"
  },
Then (locally) I held my breath and ran sst deploy --stage production --verbose. Thank fuck! I was overwhelmed with relief, when I saw things had gone smoothly, and everything was back online.
For a bit I even contemplated calling it here, but I knew that deploying locally and deploying in the CI were two very different things. However, having tasted this victory, I was confident I could coax a second from the CI runner.
So, with a foolish grin, I pulled the website down with sst remove, because I knew an even greater victory awaited me in the CI runner.
Overcoming the CI runner
Since everything worked locally, I figured either it would just work in the CI runner, or if it didn't, I could just further reduce the barriers to the build step like I did earlier. So, I rebased main onto production and pushed things through.
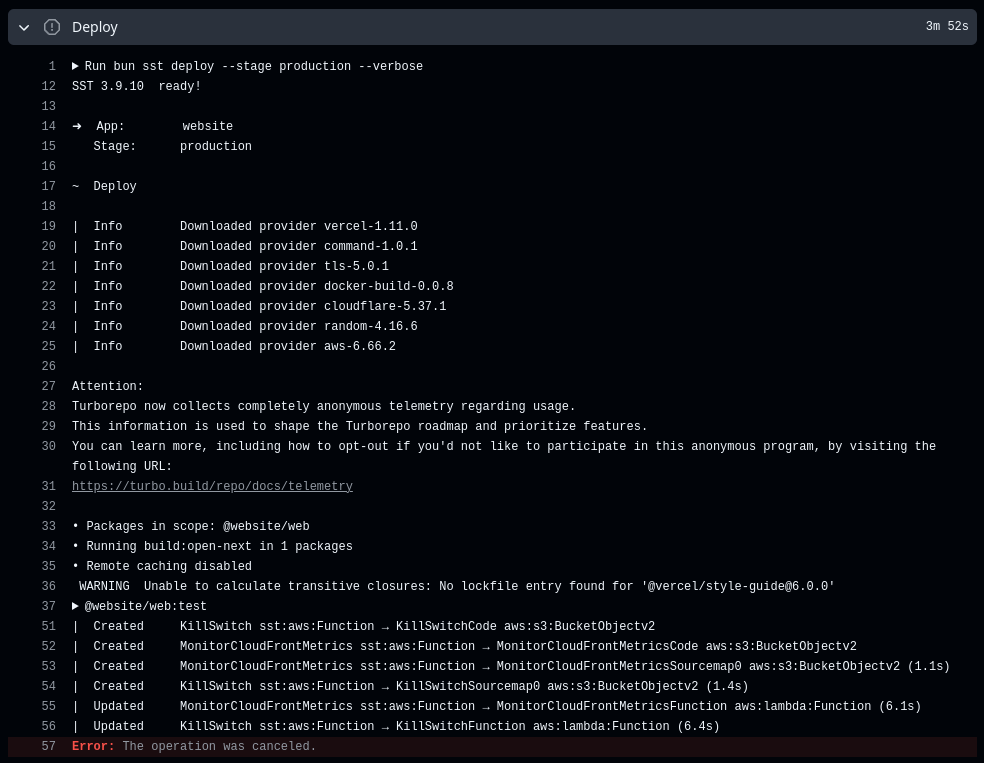
Unsurprisingly, things did not just work. However, I did have an inkling of what I was doing this time around, so I got to work.
Experiment 01: Isolating the Tasks
From earlier, I altered the build commands back to what they were, in case that was causing a problem.
export const web = new sst.aws.Nextjs("Web", {
  path: "apps/web",
-  buildCommand: "bun run turbo build:open-next;",
+  buildCommand: "turbo build:open-next",
  server: {
    runtime: "nodejs22.x"
  },
Then I altered the tasks array somewhat back to what it was (which failed locally, but this is science now). I set prebuild to depend on nothing, and made test depend on prebuild (as it was).
  "extends": ["//"],
  "tasks": {
    "prebuild": {
+      "dependsOn": [],
      "inputs": ["$TURBO_DEFAULT$", "content/**"],
      "outputs": [".contentlayer", ".contentlayermini", ".versionvault"]
    },
    "test": {
-      "dependsOn": []
+      "dependsOn": ["prebuild"]
    },
    "build": {
      "dependsOn": ["test", "^build"],
This gave an interesting result.
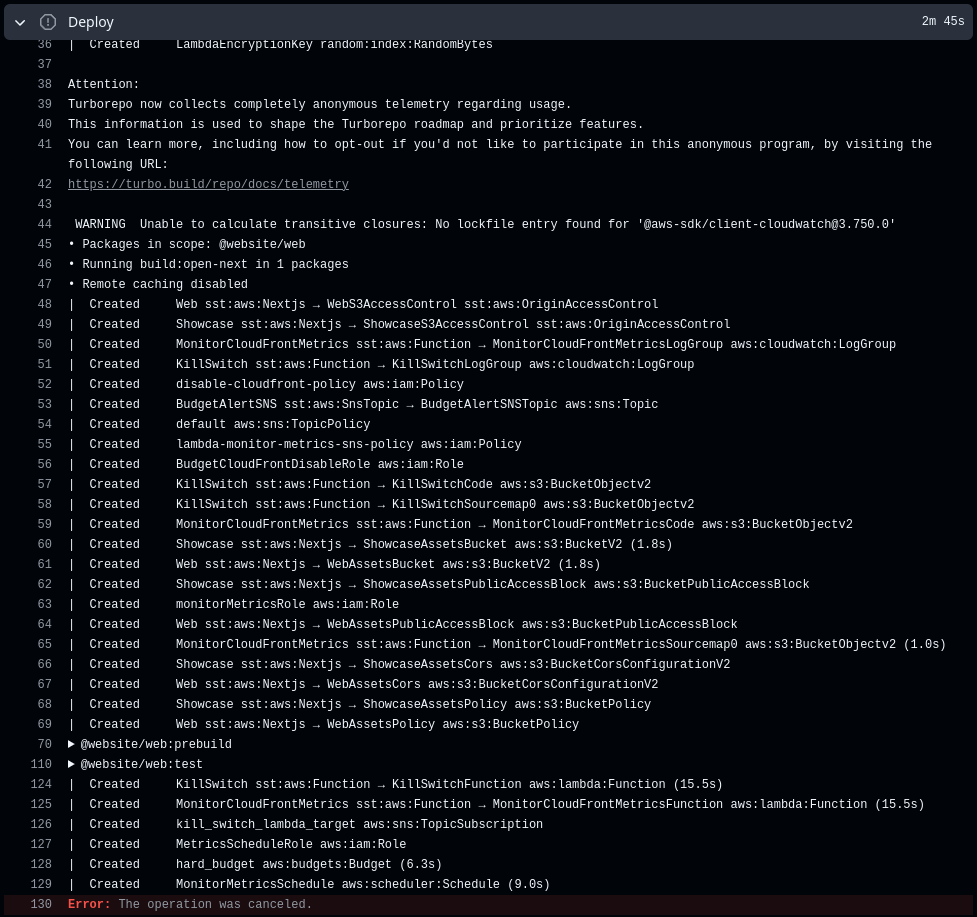
While I wasn't enthusiastic about what I saw, it was an interesting result. In hindsight, this might've worked, I think I just got nervous around the two-minute mark and assumed the worse. Still, I pressed on.
Experiment 02: Simplifying the Task Dependencies
I decided to do two things. I continued to tweak the build command, and then I did what I believed was the solution (simplifying the task deps) to start at the build task immediately.
export const web = new sst.aws.Nextjs("Web", {
  path: "apps/web",
-  buildCommand: "turbo build:open-next",
+  buildCommand: "turbo build:open-next;",
  server: {
    runtime: "nodejs22.x"
  }
    "test": {
-      "dependsOn": ["prebuild"]
+      "dependsOn": []
    },
    "build": {
-      "dependsOn": ["test", "^build"],
+      "dependsOn": ["^build"],
      "outputs": [".next/**", "public/dist/**", "public/sw.js"],
      "inputs": [
        "$TURBO_DEFAULT$",
This gave me the result I was working so hard towards.
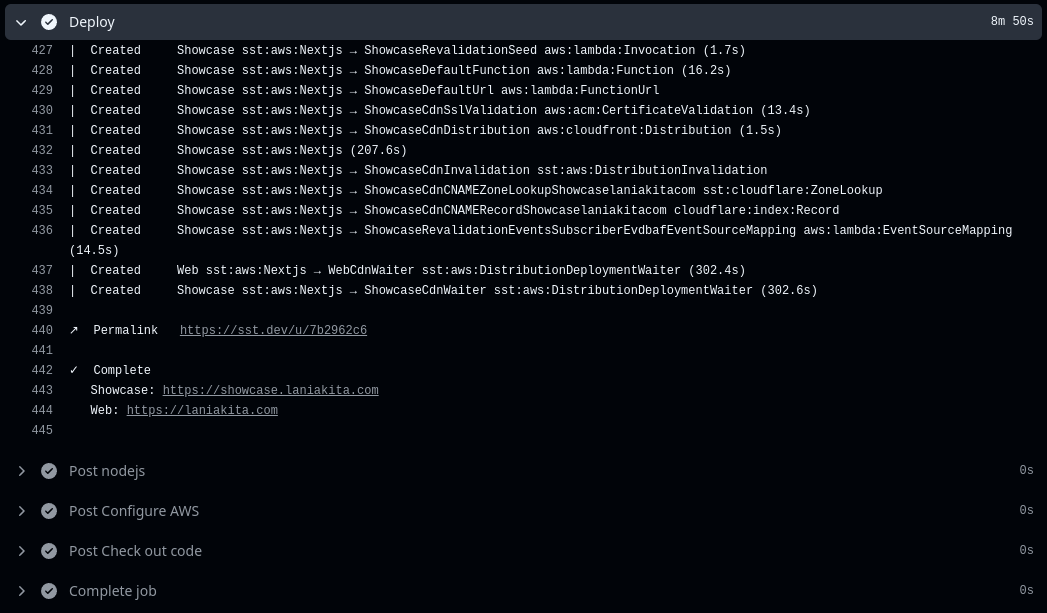
I did it! I did the thing! I was ecstatic for the rest of the evening, basking in victory. It's just unfortunate this did not last into the next day when I setup the dev workflow. My attempt at integrating the lesson I had just learned.
Revenge of the CI Runner
In setting up the dev Action Workflow (about two weeks ago at the time of writing), I hit a painfully familiar snag—after hitting a few unrelated snags, of course.
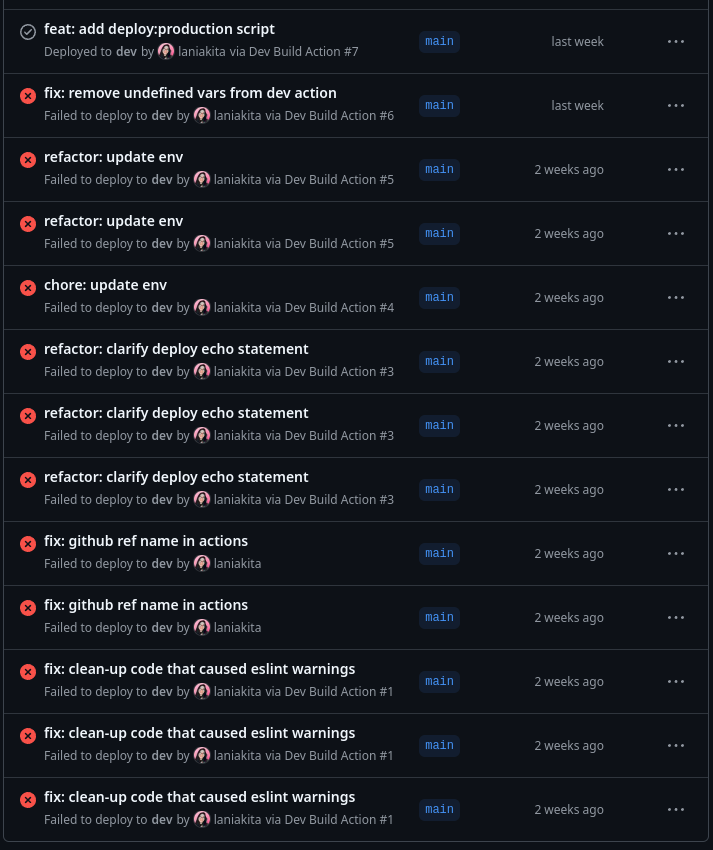
Let me preface with: this adventure wasn't as bad as it looks. In order:
- The first five build attempts failed due to a misconfiguration of an AWS role.
- The next two failed due to my handle failed deploy job on failure, failed to unlock the state (ironic).
- The eighth run I canceled due to seeing a very familiar deploy printout
- Runs nine and ten timed-out (just like before)
- Run eleven (Dev Build Action #5 attempt 2) failed due to state being locked again
- Run twelve (Dev Build Action #6) I canceled after it seemed like it was going to just hang.
- Run thirteen (what a lucky number) succeeded as Dev Build Action #7.
While I am going to explain what I changed, to make run thirteen a success, I do need to preface that my changes are apparently no longer necessary given the success of the most recent build action (#19). I'll explain that towards the end.
Nuclear Option: SST buildCommand set to "exit 0;"
After banging my head against the keyboard in frustration, I decided upon the nuclear option. Instead of letting sst deploy run the build command, it's possible to just let turbo do it instead. This is very similar to the Nx Monorepo Configuration guide in the OpenNext Docs.
In my root turbo.json I created a deploy task that depends on build.
{
  "$schema": "https://turbo.build/schema.json",
  "tasks": {
    "build": {
      "dependsOn": ["^build"]
    },
+    "deploy": {
+      "dependsOn": ["build"]
+    },
  }
}
In my root package.json I added deploy and deploy:dev to the scripts object.
{
  "scripts": {
    "build": "turbo run build",
    "dev": "turbo run dev",
    "lint": "turbo run lint",
    "test": "turbo run test",
    "test:watch": "turbo run test:watch",
+    "deploy": "turbo run deploy",
+    "deploy:dev": "turbo run deploy && sst deploy --stage=dev --verbose"
  },
}
In my sst.aws.Nextjs function I set the buildCommand to exit 0; (thus SST won't handle the build process).
export const web = new sst.aws.Nextjs("Web", {
  path: "apps/web",
-  buildCommand: "bun run build:open-next",
+  buildCommand: "exit 0;",
Finally In the nested turbo.json of each application (@website/web, @website/showcase), I created a task called deploy, and set it dependent on the build:open-next task.
{
  "extends": ["//"],
  "tasks": {
    "build": {
      outputs": [".next/**", "public/dist/**", "public/sw.js"],
      "inputs": ["$TURBO_DEFAULT$", "next.config.*"]
    },
    "build:open-next": {
      "dependsOn": ["build"],
      "env": ["OPEN_NEXT_VERSION", "NEXT_PUBLIC_DEPLOYED_URL"],
      "outputs": [".open-next/**"],
      "inputs": ["$TURBO_DEFAULT$", ".open-next.config.ts"]
    },
+    "deploy": {
+      "dependsOn": ["build:open-next"]
+    }
    }
  }
I also altered the Dev workflow to run bun run deploy:dev (the script in the root package.json) instead of sst directly.
      # ROTFB
      - name: Deploy
-        run: bun sst deploy --stage dev --verbose
+        run: bun run deploy:dev
        timeout-minutes: 30
This worked perfectly.
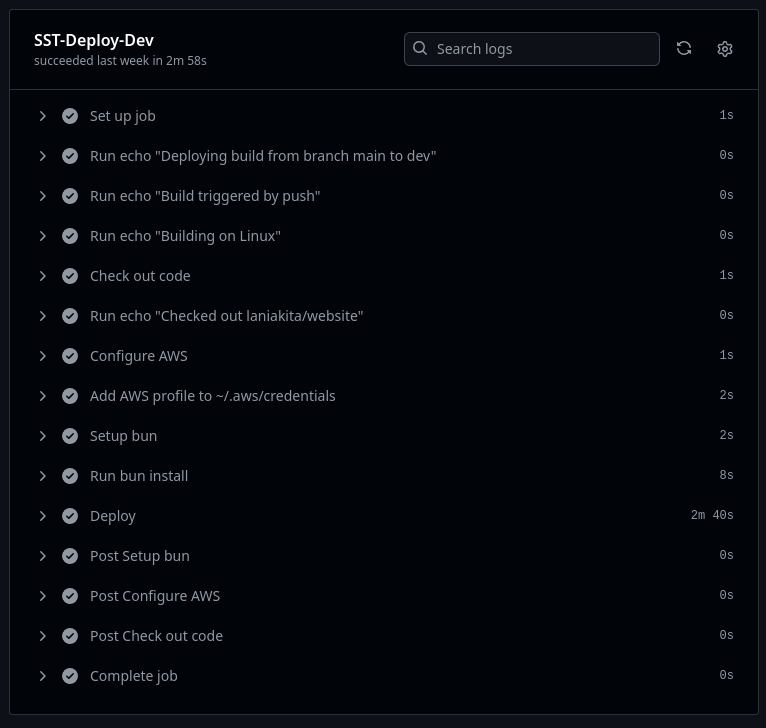
This worked so perfectly, I've had consistent deployments with it no problem over the last week and a half or so. There is one caveat, which leads us to our next section.
Dude, where's my variables?
Bypassing SST's buildCommand, like I did, the rub is that you lose out on having resources passed down to the application's build environment. While the resources part can be solved with wrapping turbo deploy with sst shell i.e. sst shell bun run turbo deploy, that apparently does nothing for the environmental variables that you can define in a config.
export const web = new sst.aws.Nextjs('Web', {
  path: 'apps/web',
  buildCommand: 'exit 0;',
  server: {
    runtime: 'nodejs22.x',
  },
  environment: {
    NEXT_PUBLIC_DEPLOYED_URL:
      $app.stage === 'production' ? 'https://laniakita.com' : `https://${$app.stage}.laniakita.com`,
  },
  domain: {
    name: $app.stage === 'production' ? 'laniakita.com' : `${$app.stage}.laniakita.com`,
    dns: sst.cloudflare.dns(),
  },
});
So, in the example above, a variable defined between lines 7-12 just doesn't get passed down. While I've thought about some clever workarounds importing specific .env files based on a task, I decided to try something.
Going Full Circle
Last night, I was brought full circle, when I tested the waters on returning to what I was doing weeks ago, before all these shenanigans took place. I used the buildCommand.
export const web = new sst.aws.Nextjs("Web", {
  path: "apps/web",
-  buildCommand: "exit 0;",
+  buildCommand: "turbo run build:open-next"
Likewise, I edited the scripts in the root package.json once more.
{
  "scripts": {
    "build": "turbo run build",
    "dev": "turbo run dev",
    "lint": "turbo run lint",
    "test": "turbo run test",
    "test:watch": "turbo run test:watch",
    "deploy": "turbo run deploy",
-   "deploy:dev": "turbo run deploy && sst deploy --stage=dev --verbose"
-   "deploy:production": "turbo run deploy && sst deploy --stage=production --verbose"
+   "deploy:dev": "sst deploy --stage=dev --verbose",
+   "deploy:production": "sst deploy --stage=production --verbose"

  },
}
I pushed everything from my local terminal, and was surprised to see a little green check mark against my hesitant commit message.

I then sent several more changes through, to test whether that was a fluke. It was not.
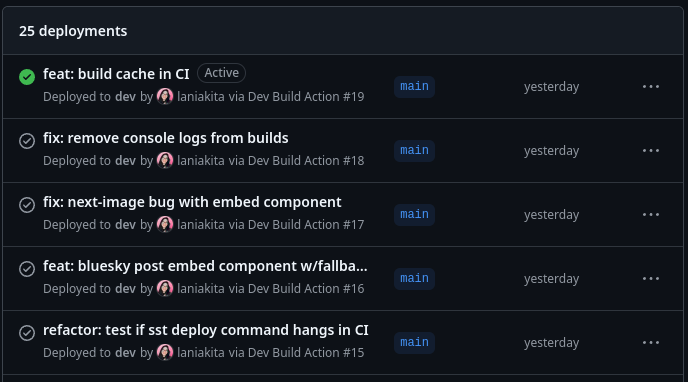
Given everything just works, like it should. Like it did before, for months, leading up to this. I'll admit to feeling a little vexed that evening, but more so just relieved.
Discussion
This was an adventure. This was too much adventure. I want off Mr. Bone's Wild Adventure.

If the internet is like a series of tubes, then the wild ride I just endured can be blamed on a jammed tube, a criss-crossed tube, and a return tube.
In other words, this website failed to deploy to production, a jam in the CI tube, which culminated in the site going offline. Making some changes to how the site is processed through the tube, let it go through. Yet, those same changes weren't sufficient for a different tube, and it jammed again. A criss-crossing if you will from failure-to-success-to-failure-to-success. Then, everything fell down the return tube (for reasons), and we went full circle with the website being able to go through the dev tube with the original build instructions.
Metaphorical tubes aside, I had originally intended this article to be somewhat instructional. I had assumed that this was clearly a configuration problem on my part, because a poor craftsman blames their tools. So, I wanted to figure it out, write it down, and paste my opinionated configuration guide to the internet for anyone else looking to configure Turborepo, Bun, Next.js and SST with a Github Action to handle deployments.
However, given my experiment last night, which demonstrated sequential, successful deployments were possible using the original, wrapped build commands... I've been given some pause by this whole thing, I'll admit.
In the end, I'm left only more confused, than when I began.